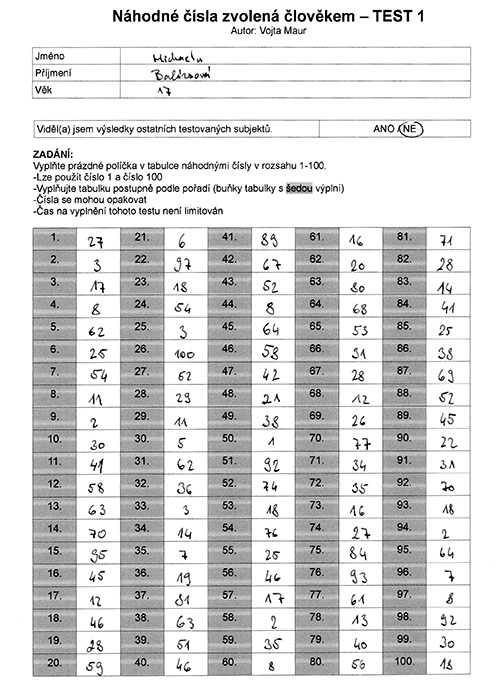
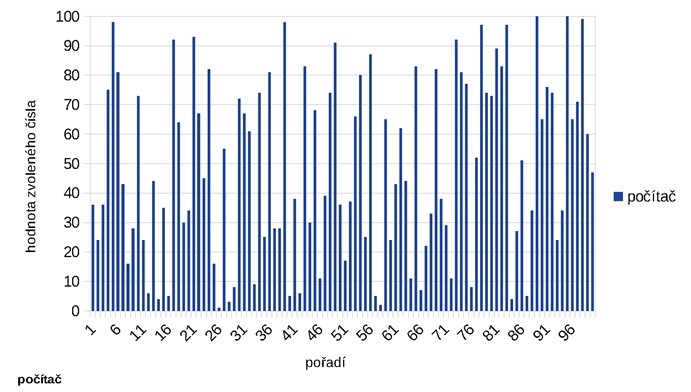
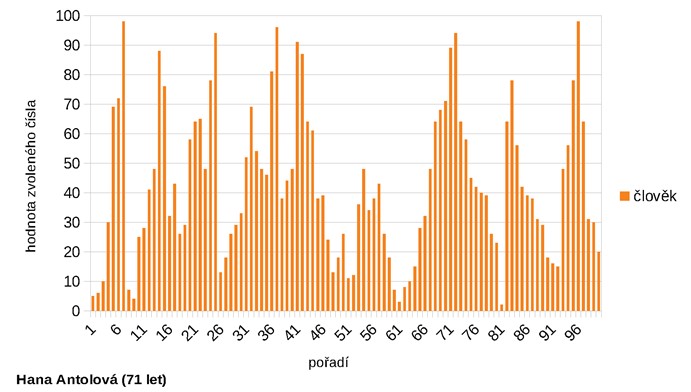
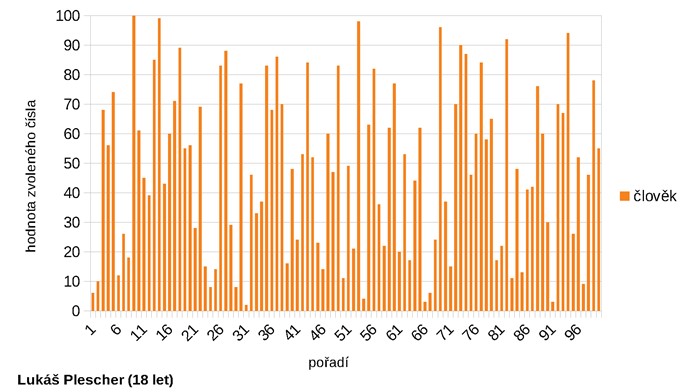
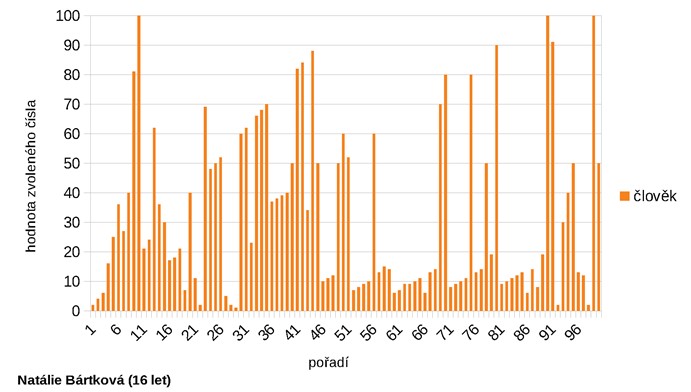
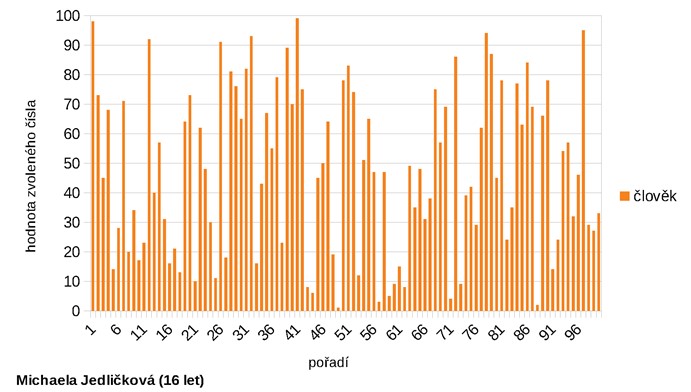
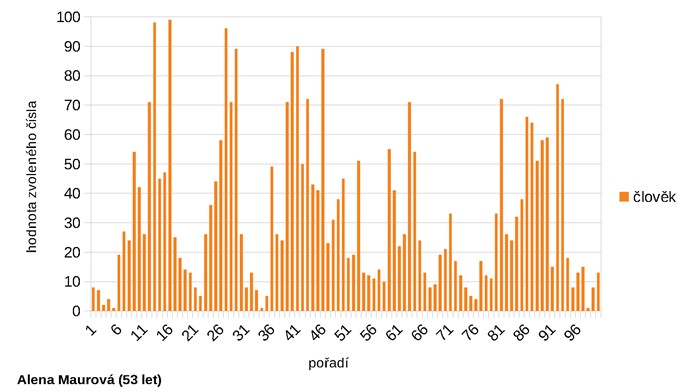
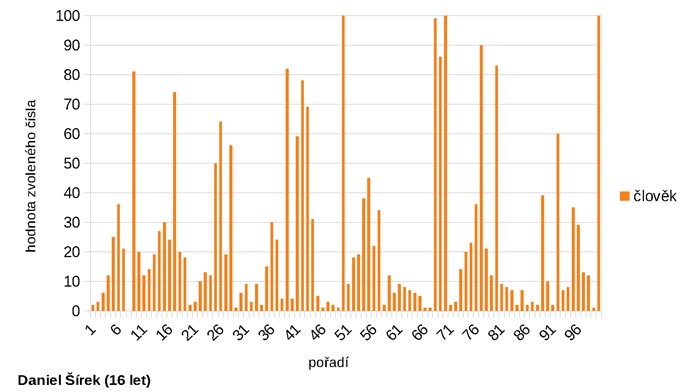
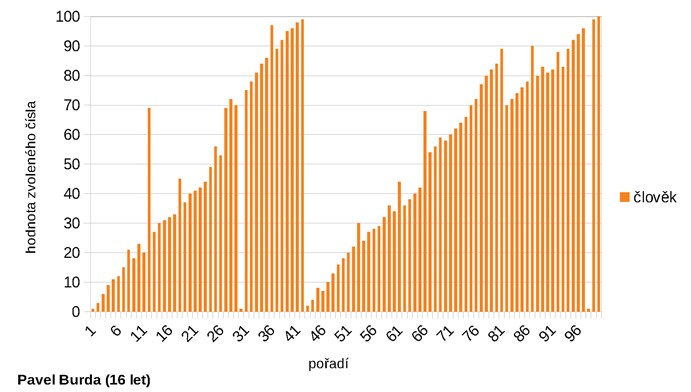
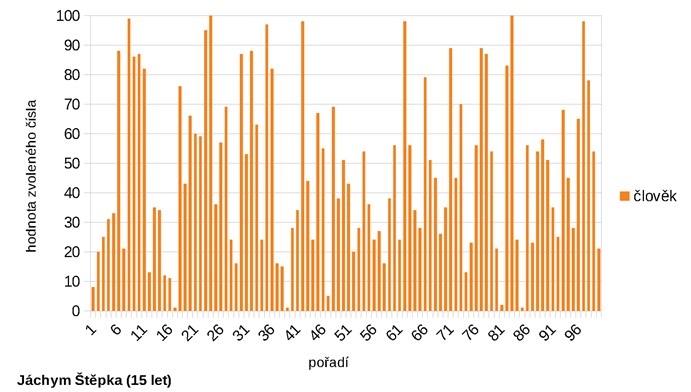
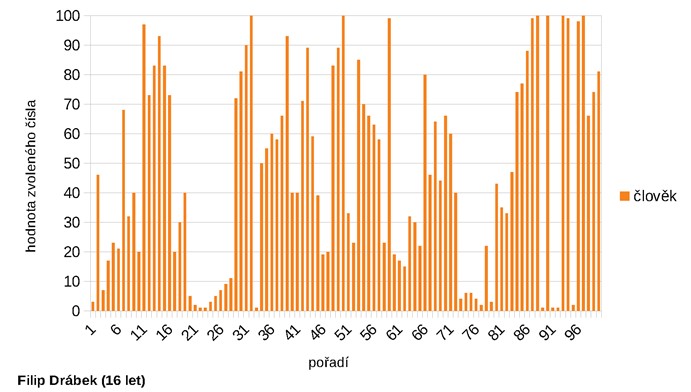
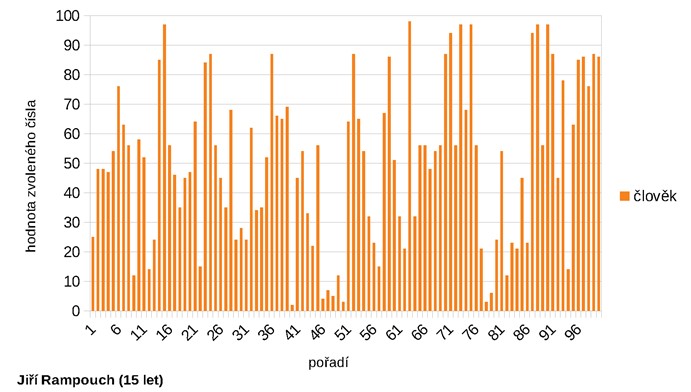
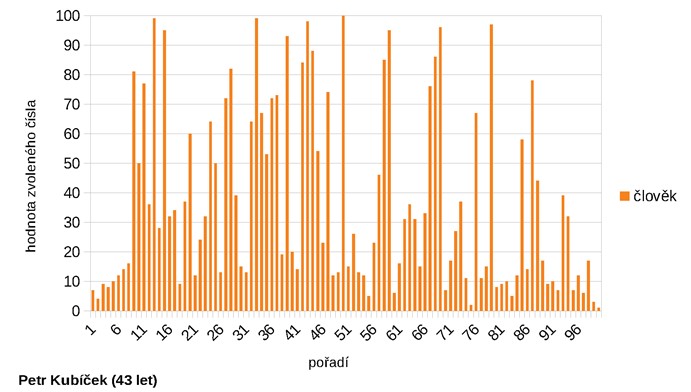
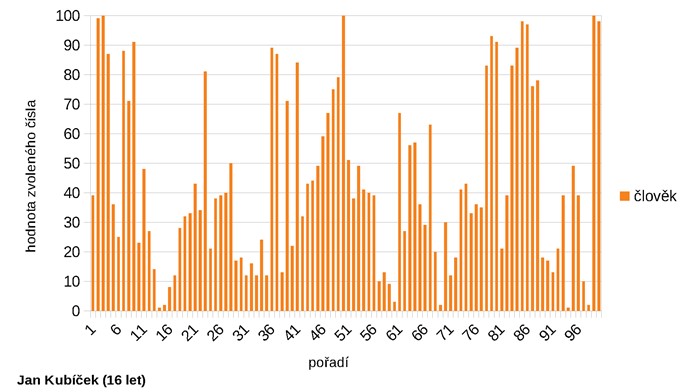
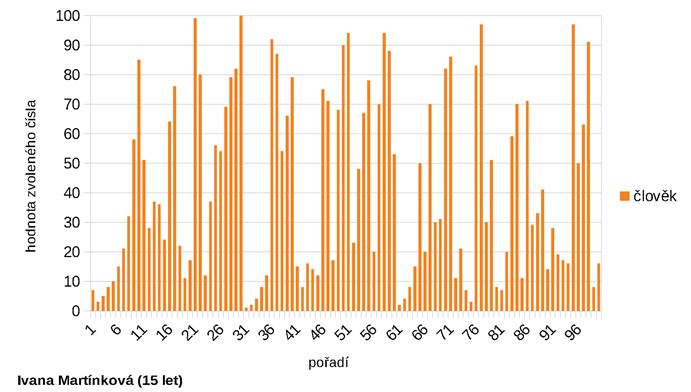
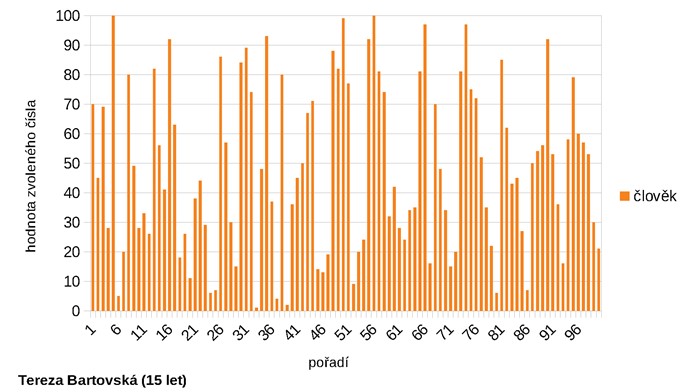
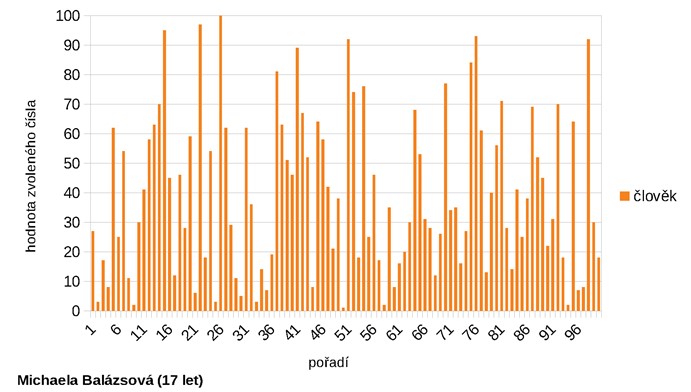
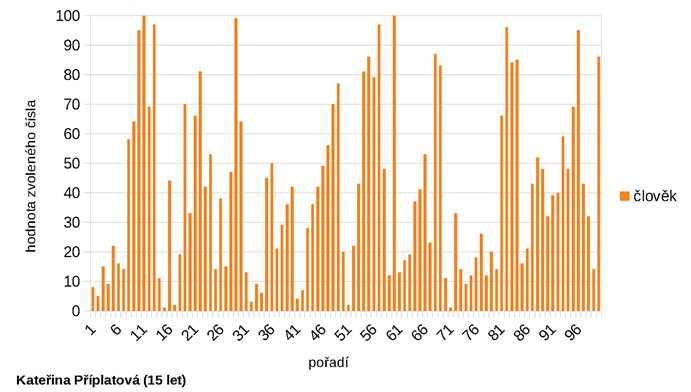
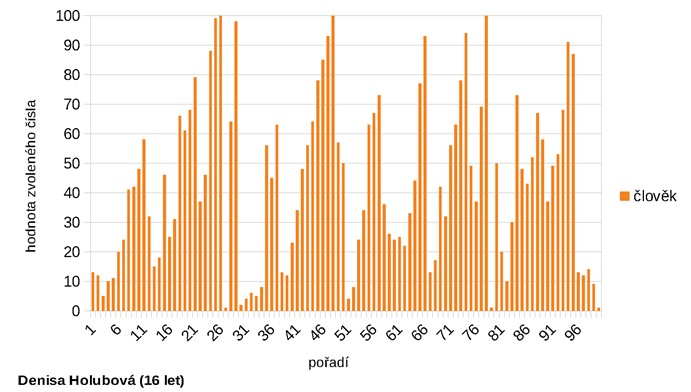
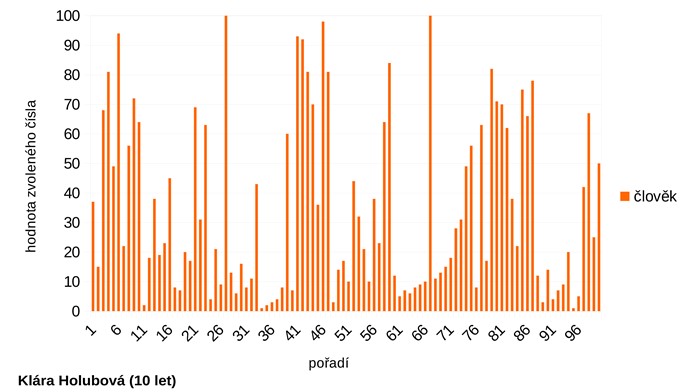
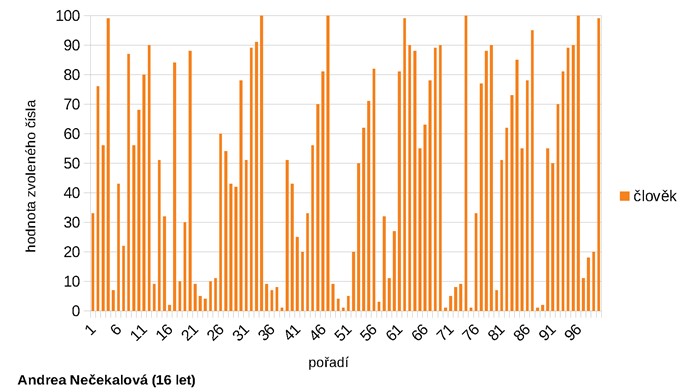
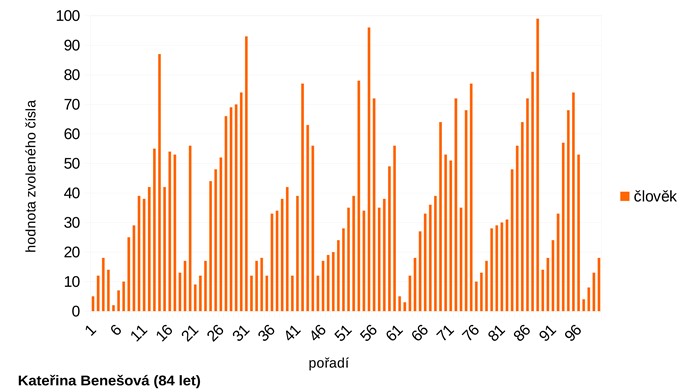
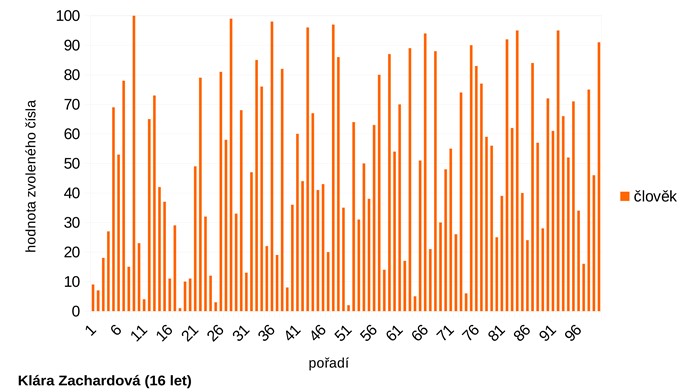
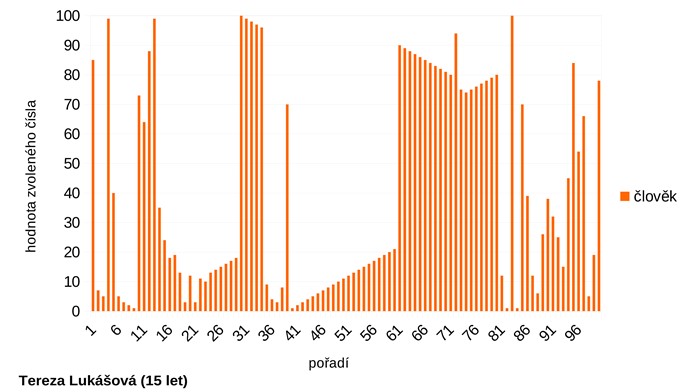
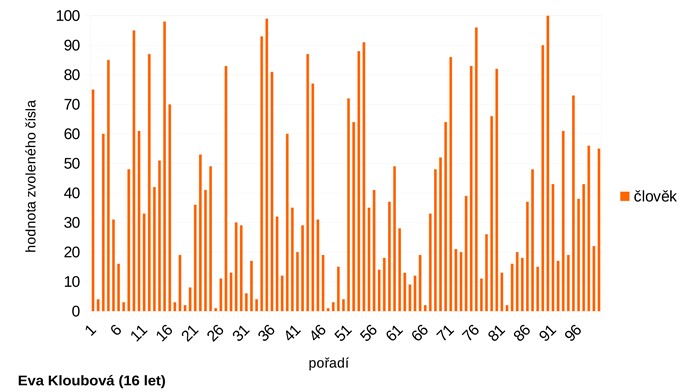
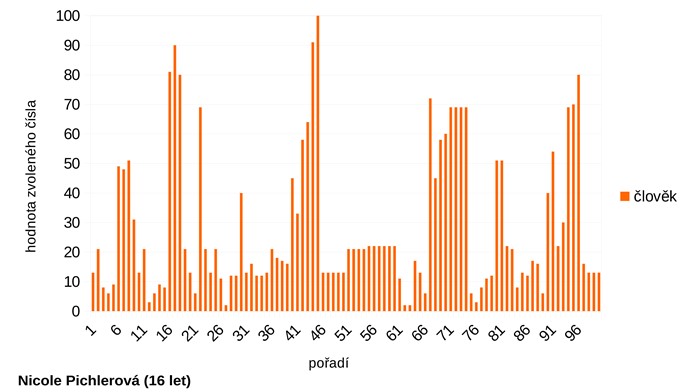
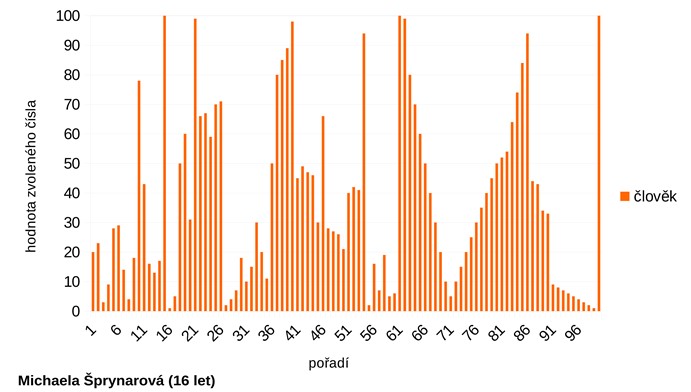
In this project, a questionnaire was distributed to several people. The participants wrote down 100 random numbers between 1 and 100 that came to mind. I then entered this data into a computer and created one graph for each questionnaire. The horizontal x-axis represents the order of the individual numbers, and the vertical y-axis represents the values of the selected numbers. The blue graph was generated by a computer, specifically a random number generator. When comparing all the graphs as a whole, it is evident that each test subject has a unique graph with their own pattern of number selection. It can also be observed that certain nearly identical cycles recur in many graphs (mostly in the form of a gradual increase and decrease in numbers).
NUMBERS SELECTED BY THE RANDOM NUMBER GENERATOR
NUMBERS CHOSEN BY PEOPLE
COMPLETED SAMPLE QUESTIONNAIRE